About — Sources
Our project’s sources
For our project about the WNBA’s growth and storied history, we used several comprehensive primary and secondary sources, along with our dataset, to explore the social, cultural, and political factors contributing to the league’s development. A majority of these sources were about the growing interest in women’s sports and societal attitudes toward female athletes. The information found in our dataset, Across the Timeline, was corroborated with external data to address this trend. We used additional viewership and attendance from Nielsen [1] and the NBA [2] to inform parts of our bar charts, line graphs, and maps. Our research also examined the disparities between the WNBA and the NBA. Historically, the WNBA has faced significant challenges, such as smaller audiences and salaries compared to the NBA [3]. However, these sources also informed topics in our project about the WNBA’s values. While asking questions about how the WNBA’s values changed over time, we found historical sources that provided an in-depth look at the league’s history, illustrating how it has evolved from its inception to the present day and adapted to its circumstances.
One of our key sources, “The History of Women’s Professional Basketball in the United States with an Emphasis on the Old WBL and the New ABL and WNBA,” an academic article written by Donald Staffo, was invaluable in providing insight into the culture within and around the WNBA. [4] Staffo explained how the disparity in audience size and salaries between leagues fostered a unique attitude within the WNBA. [4] This attitude, compared to those in the NBA, was purpose-oriented, pursuing sports “for sports sake.” [4] We found this argument interesting and it carried our questions forward in a different path than we initially intended. We also gathered several other historical sources that discussed the WNBA’s role as a trailblazer in promoting LGBTQ+ rights and creating an inclusive environment for players and fans. Lyndsey D’Arcangelo’s articles written for Just Women’s Sports [5] and the New York Times, [6] respectively, were deeply insightful and gave us insight to the league’s history and approach to inclusivity. Overall, our research provided a multi-faceted understanding of the WNBA’s past, present, and future. We looked at the growth of the league with respect to a rising trend in interest in women’s sports. We chronicled the history of the league, pointing out events that were important for inclusion, visibility, or the advancement of women’s sports in America. We analyzed data from Across the Timeline and other sources to map attendance patterns related on societal factors. This comprehensive approach allowed us to appreciate the complex factors contributing to the WNBA’s growth and the league’s increasing prominence in a male-dominated field.
Citations
[1] Nielsen. “Women’s Sports Viewership on the Rise.” Nielsen, August 2, 2023. https://www.nielsen.com/insights/2023/womens-sports-viewership-on-the-rise/.
[2] ESPN. “NBA Attendance Report – 2023.” ESPN. Accessed August 4, 2024. https://www.espn.com/nba/attendance.
[3] Spotrac. “WNBA Minimum Salaries.” spotrac.com. Accessed August 3, 2024. https://www.spotrac.com/wnba/cba/minimum/.
[4] Staffo, Donald F. “THE HISTORY OF WOMEN’S PROFESSIONAL BASKETBALL IN THE UNITED STATES WITH AN EMPHASIS ON THE OLD WBL AND THE NEW ABL AND WNBA.” Physical Educator 55, no. 4 (Winter, 1998): 187. https://www.proquest.com/scholarly-journals/history-womens-professional-basketball-united/docview/1437911016/se-2.
[5] D’Arcangelo, Lyndsey. “The WNBA’s LGBTQ+ Evolution.” Just Women’s Sports, March 5, 2024. https://justwomenssports.com/reads/this-is-peoples-truth-the-wnbas-lgbtq-evolution/.
[6] D’Arcangelo, Lyndsey. “After Years of Snubbing LGBTQ+ Fans, WNBA Is Sports’ Most Welcoming League.” The New York Times. Accessed August 3, 2024. https://www.nytimes.com/athletic/3333605/2022/06/15/wnba-lgbtq-fans/.
About — Processing
Processing our sources & data
For our project, we gathered attendance data from Across the Timeline and other data, such as viewership data, from sources like Nielsen and the NBA website. We either relied on website-provided .csv files or created our own spreadsheets with Google Sheets.
We used Tableau for our data visualizations as the software gave us the best range of options to create a variety of graphs and charts. For the maps, we created spreadsheets, inputting states and political leanings manually.
The timelines were made in TimelineJS, which provides a template for ease of access. Images were found online and credited in each timeline.
Citations
[1] Nielsen. “Women’s Sports Viewership on the Rise.” Nielsen, August 2, 2023. https://www.nielsen.com/insights/2023/womens-sports-viewership-on-the-rise/.
[2] ESPN. “NBA Attendance Report – 2023.” ESPN. Accessed August 4, 2024. https://www.espn.com/nba/attendance.
About — Presentation
Presenting our findings
We built our website, structurally and visually, around our research to strengthen the impact of our research questions and findings. UCLA provided us access to a HumSpace domain, and Alexander, the web designer, used WordPress for the website design. A color scheme of orange, black, and gray was selected, a reference to the colors of the WNBA. Our website features user-friendly content tabs on the header for ease of access. In consideration of accessibility options, a ‘dark mode’ button, visible on the bottom right corner, was implemented. Headers were also used for users that rely on site readers for navigation.
Data visualizations were made in Tableau and TimelineJS. Tableau provided an easy-to-use interface; bar charts and line graphs were simple to create and maps were auto-generated through a “States” column being added to the spreadsheet. TimelineJS was also simple to use as the site provides a template to input dates and events. To visually present our data, we input embed codes into WordPress Shortcode fields / blocks.
WNBA Power Scholars
The members of our group!

Kanwulia
Project Manager
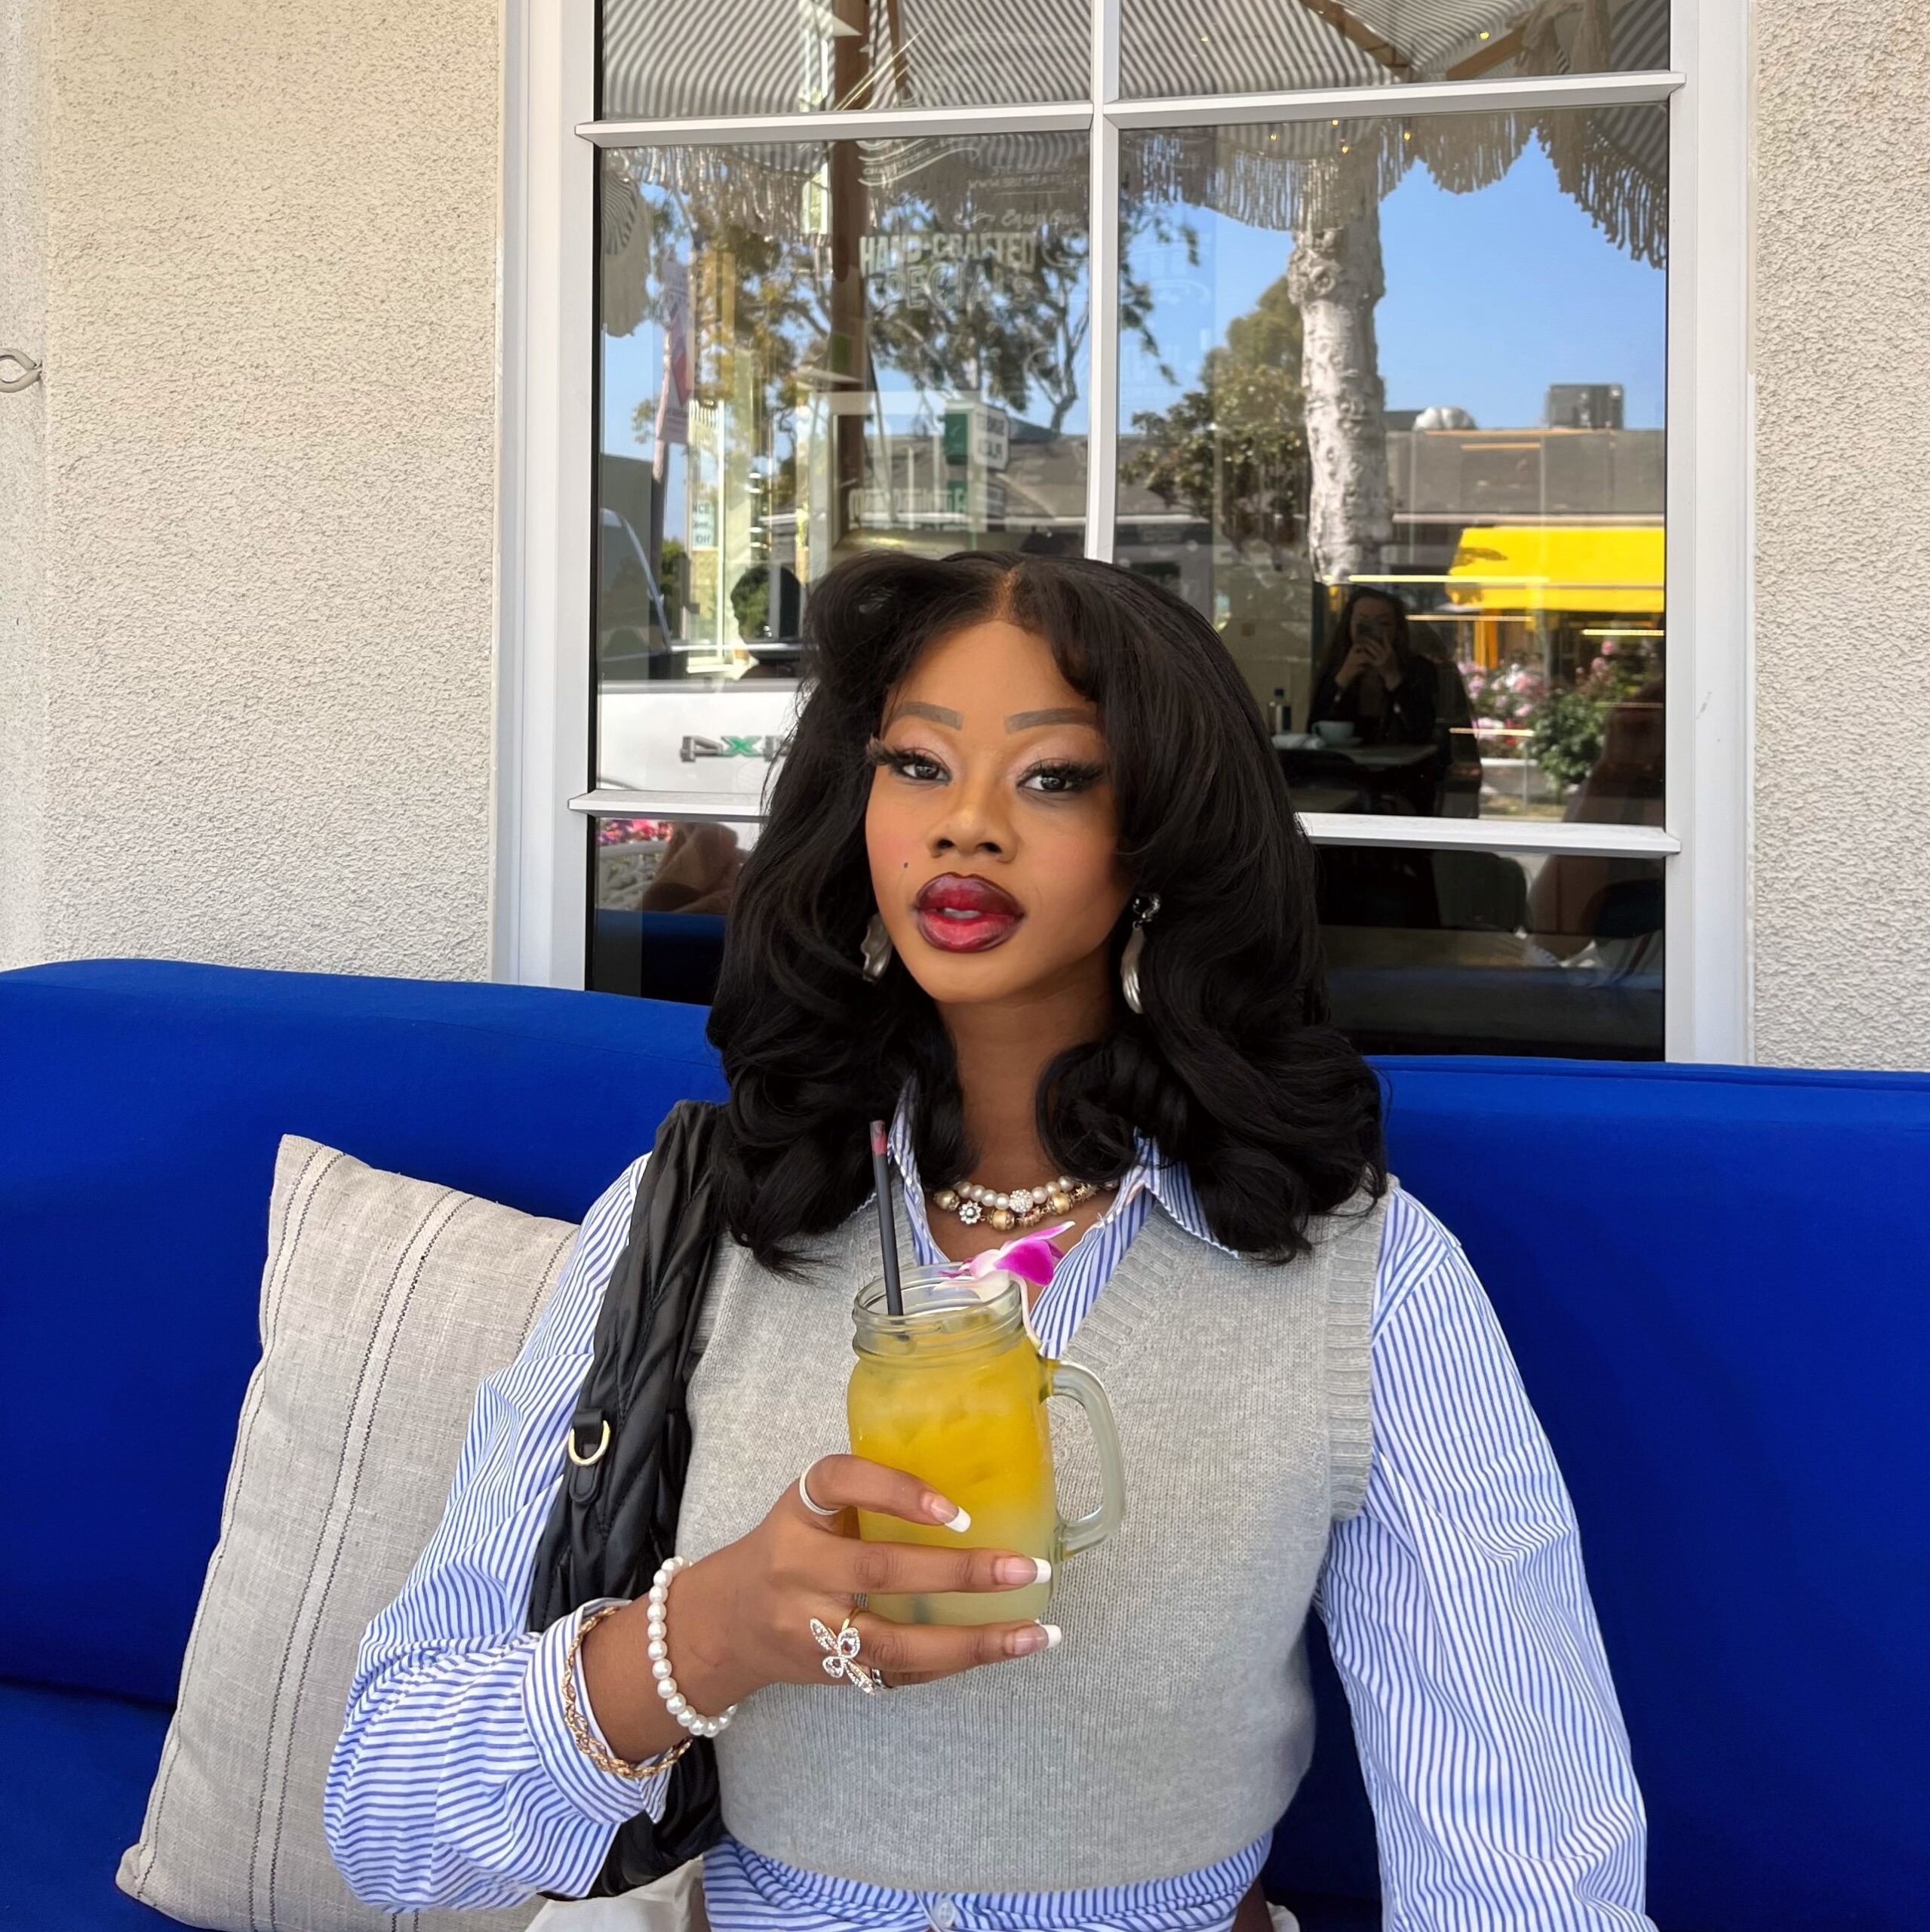
Hi! I am Kanwulia, a fourth year sociology major and digital humanities minor. As project manager I ensured deadlines were met through scheduling weekly meetings for our group and doing individual check ins. I also helped allocate sources for our research questions, and designed and wrote the about page.

Michael
Data Specialist
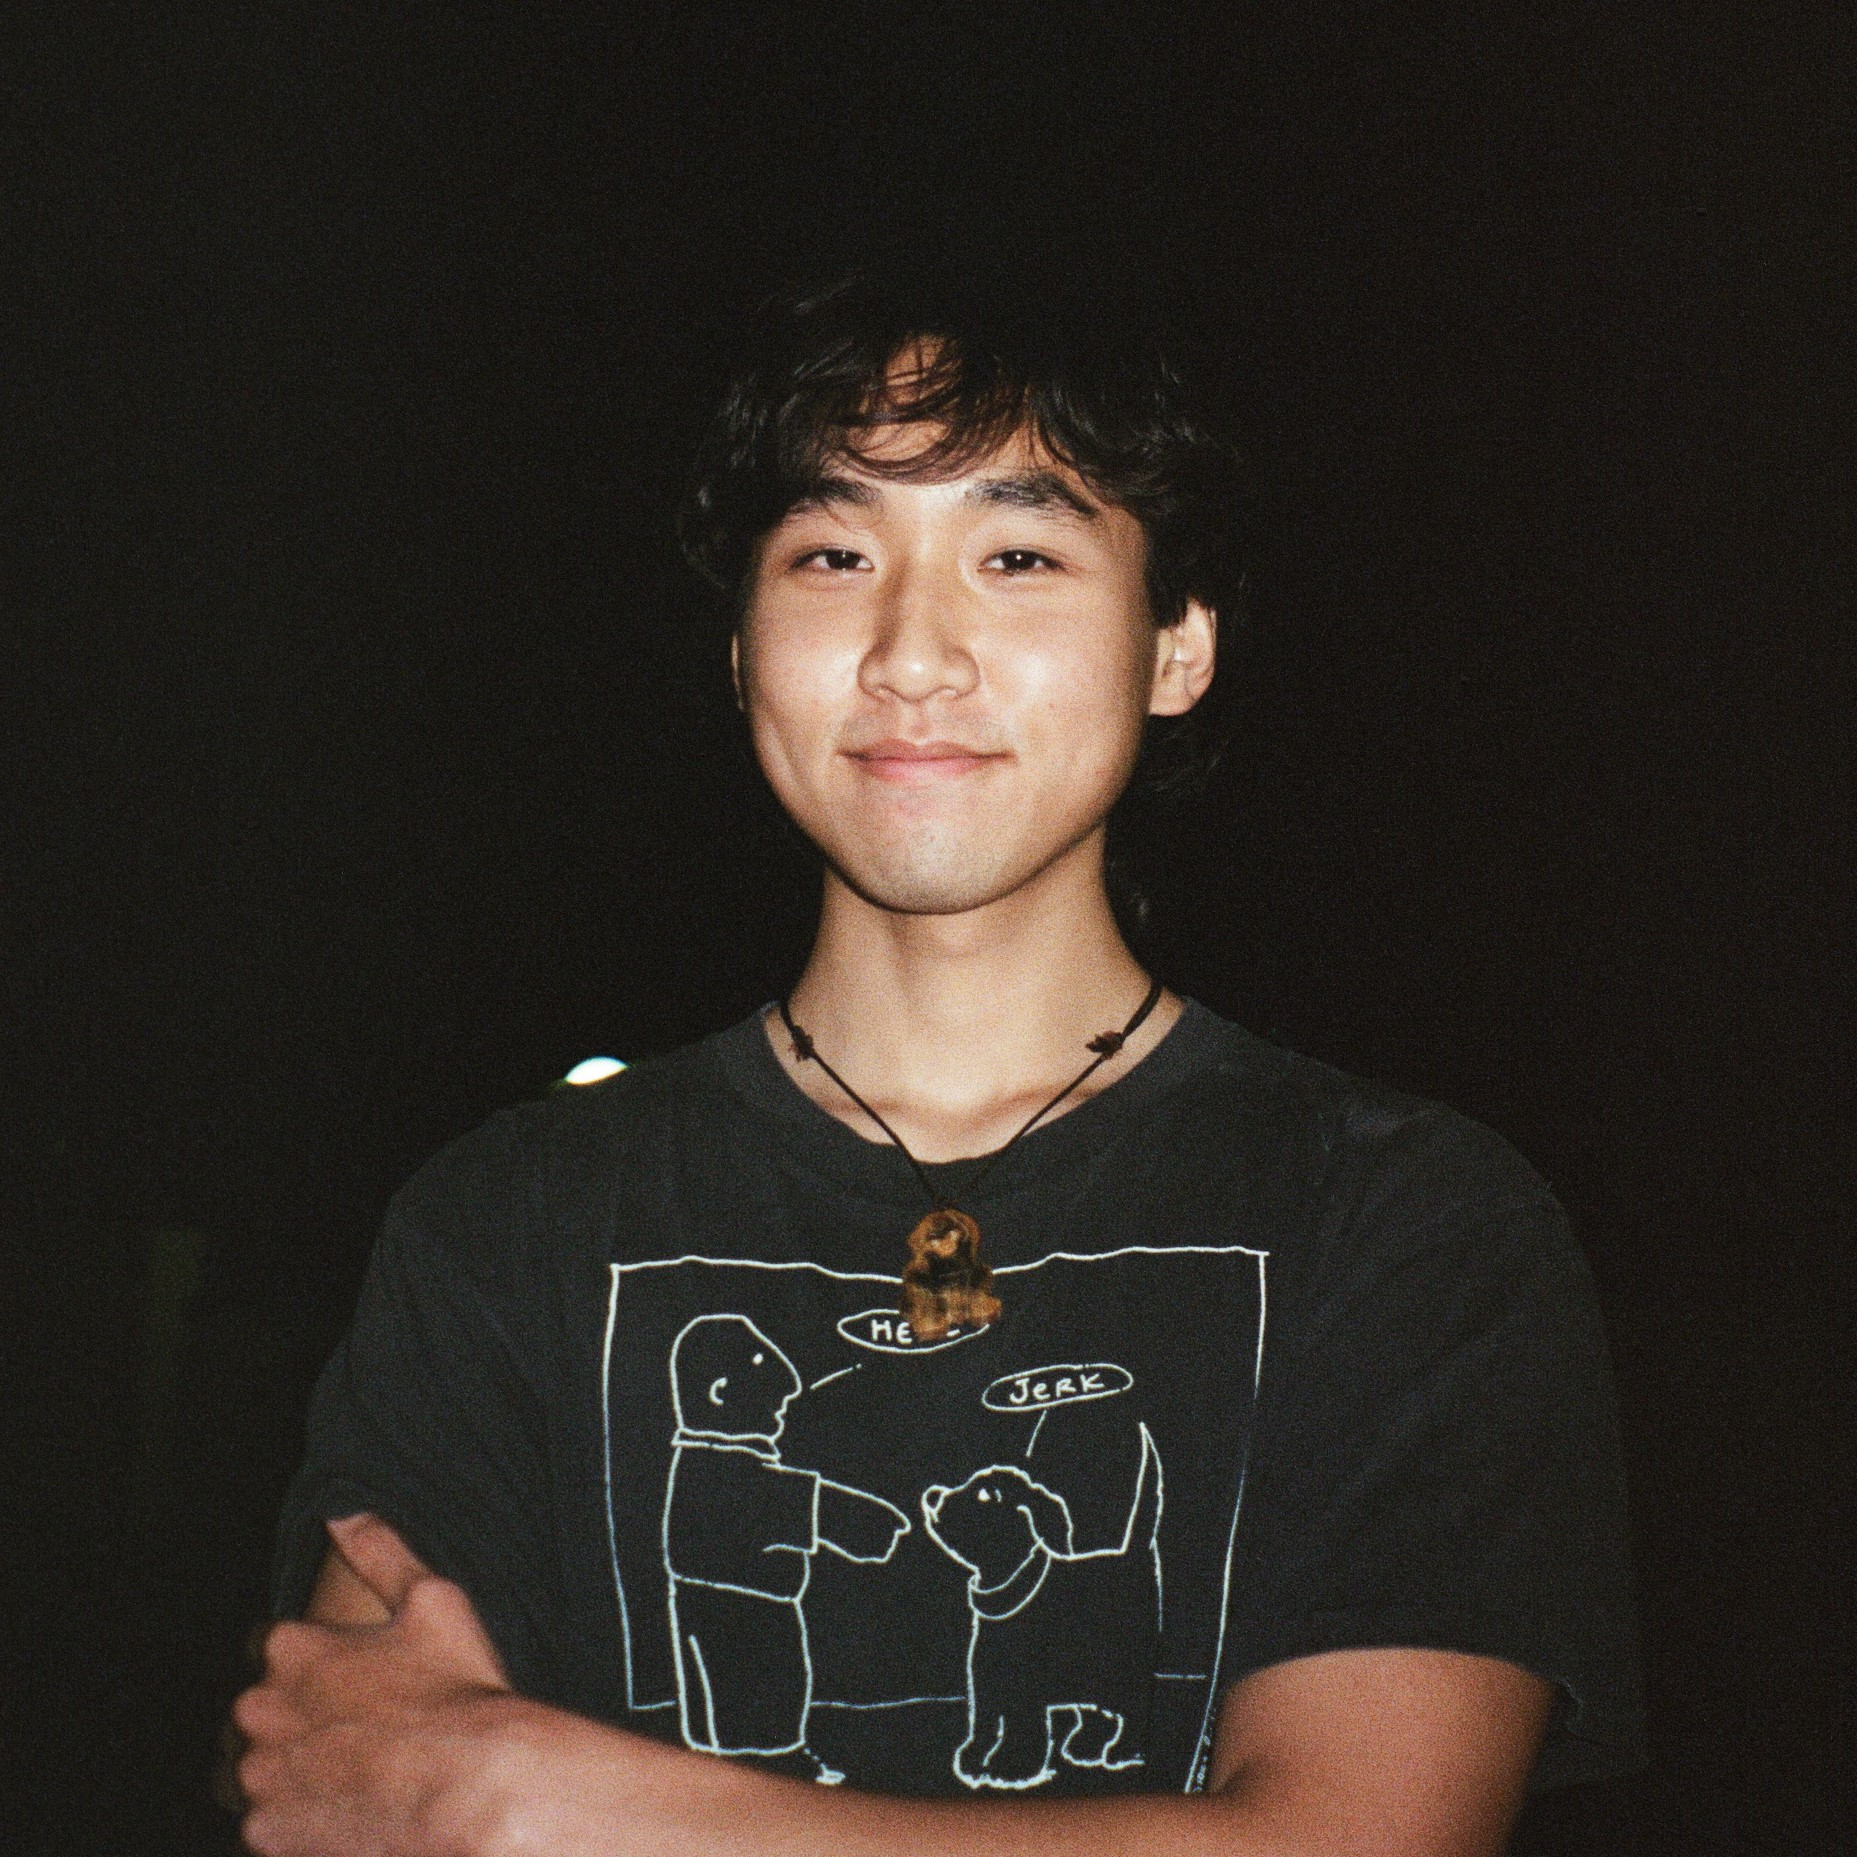
Hey, my name is Mike. I am a second-year Computer Science and Applied Mathematics major at UCLA. A fun fact about me is that I competed in the US History Bee. As the data specialist, I helped create and clean the data for several visualizations. I also planned the setup and architecture of these visualizations and their implementation into the project. Additionally, I wrote and planned both timelines of the WNBA.

Alexander
Web Designer
Hello! I’m Alexander, a fourth-year Design Media Arts major. As Web Designer, I was responsible for handling anything related to the project website. I also wrote & edited portions of the content for our project, created data viz, wrote data analysis, found & annotated numerous sources, and assisted my fellow group members in anything they needed help with.

Chloe
Data Visualization Specialist
Hello, My name is Chloe Guo! I’m a third year Statistics and Data Science major student. As the Data Visualization Specialist for our project, I transformed our raw data sets into visualizations that highlighted patterns in our attendance data and illustrated relationships both within our data set and with external data sets we incorporated into the project. These visualizations made it easier for others to observe and understand the connections and trends in our findings.

Alex
Editor
Hi! My name is Alex, a fourth-year Statistics and Data Science major. I was responsible for editing the websites main page, finalizing the presentation slides, creating data visualizations, and found sources for our research questions.

Justin
Content Developer
Hi! My name is Justin and I’m a fourth year Statistics and Data Science major. As content developer, I helped write the content for our website by summarizing our sources and providing any details surrounding our research questions. I also helped to find sources that dealt with our topic and research questions.
About — Acknowledgements
Acknowledgements
We’d like to acknowledge Dr. Albrezzi and Nick Schwieterman for being wonderful instructors and guides for our foray into Digital Humanities. Our data journey would have been impossible to navigate without your help; thank you!
We would also like to acknowledge our dataset and its founder, Maitreyi Anantharaman, for providing valuable information and inspiring our narrative. Across the Timeline provided us with the foundation to foster a new perspective on women’s sports in America.
